
India Macro Outlook 2026:
Equities | Gold | Silver | USD/INR | Crude
Data as of March 2026
Quantitative Probabilistic Forecast of how the assets could look like
What this report covers
Investopic's India Macro Outlook 2026 simulates 25,000 possible market paths over nine months using the IndQuant DDPM engine. It covers five assets — Nifty 50, Gold, Silver, Brent Crude, and USD/INR — across 47 geopolitical, macroeconomic, and domestic risk scenarios. The output is a probability distribution of outcomes, not a single point forecast.
This outlook is produced by the IndQuant DDPM-based probabilistic simulation engine, purpose-built for Indian financial markets.
The Big Picture: The Structural Case Holds
India's long-term investment case remains one of the strongest in emerging markets. A growing working-age population drives consumption. A multi-year capex upcycle, led by government infrastructure and increasingly by private manufacturing investment under the PLI scheme, supports GDP growth above 6.5%. Digital public goods (UPI, Aadhaar, Account Aggregator) have created a payments and identity infrastructure unmatched at this population scale. Global supply chain diversification away from China is pulling electronics, pharma, and auto component production into India. These structural forces are real, continuing, and not meaningfully threatened by the near-term challenges described below.
Headwinds: Why the Next Nine Months Are Different
The cyclical environment has deteriorated sharply, driven by forces largely outside India's control.
Energy. The Hormuz crisis has pushed Brent above $98. India imports 85% of its crude. Every dollar increase feeds directly into the import bill, the trade deficit, the rupee, inflation, and corporate margins. The range of oil outcomes from here is unusually wide: ceasefire could bring prices toward $70; extended blockade or Saudi infrastructure retaliation could push them well above $140.
Capital flight. Foreign institutional investors have been net sellers for multiple quarters. Elevated US yields and dollar strength make emerging market allocations less attractive. The selling is self-reinforcing: falling equities trigger further risk-off outflows, which weaken the rupee, which makes Indian assets less attractive to foreign holders.
Inflation bind. Rising energy costs, potential monsoon disruption, and heatwave-driven crop damage could push CPI into the 6.5-8% range, forcing the RBI into a hawkish hold even as growth decelerates. India experienced this exact stagflationary dynamic during the 2014 and 2023 El Nino episodes.
Political uncertainty. State elections in April 2026 (Assam, West Bengal, Tamil Nadu, Kerala, Puducherry) introduce near-term policy uncertainty, with the LPG crisis and petrol prices as dominant voter issues.
Global backdrop. Mixed Fed signals, China property weakness, European energy stress, and US-India trade tensions create a backdrop where the probability of some external shock reaching India is meaningfully elevated.
What makes this period distinctive is that these headwinds reinforce each other. Higher crude weakens the rupee, which raises inflation, which constrains the RBI, which hurts equities, which triggers foreign selling, which further weakens the rupee.
How This Analysis Was Built
This outlook simulates 25,000 possible market paths over nine months, each shaped by one of 47 real-world risk scenarios and tested against seven economic consistency rules. The model learns from 15 years of Indian market history and is guided by 12 live sentiment signals. The output is not a single forecast but a probability landscape: where outcomes are most likely to cluster, how wide the range extends, and which direction the risks lean.
What the Analysis Concludes
Equities show a mild bearish tilt (Nifty median -2%, mean -1%) with a wide range: -20% in the worst case, +23% in the best. The downside extends further than the upside. Positive scenarios (ceasefire, global recovery) are real but carry lower probability weight than the compound of energy, FII, and stagflation pressures.
Crude oil is the most asymmetric variable. Median $106 (+7%), but the extreme case reaches $187.5 (+90%) while downside is limited to -31%. The median path alone adds $15-20 billion to India's annual import bill.
The rupee weakens in most paths. Median at 102.1 (+9% depreciation), driven by oil imports, FII selling, and narrowing rate differentials. The best case (appreciation to ~85) exists in ceasefire paths, but the balance of probabilities points to weakness.
Gold is the stability anchor. A modest 1% median USD return, but +24% in crisis scenarios, and approximately +10% in INR terms when rupee depreciation is factored in. The narrowest and most favourably skewed distribution in the study.
Silver is the wild card: near-flat median, but an 83-percentage-point range between worst and best case. Lowest directional confidence.

Exhibit 1: Median 9-month outcomes. Crude and rupee depreciation lean higher; equities and silver are near-flat to mildly negative; gold is the anchor.
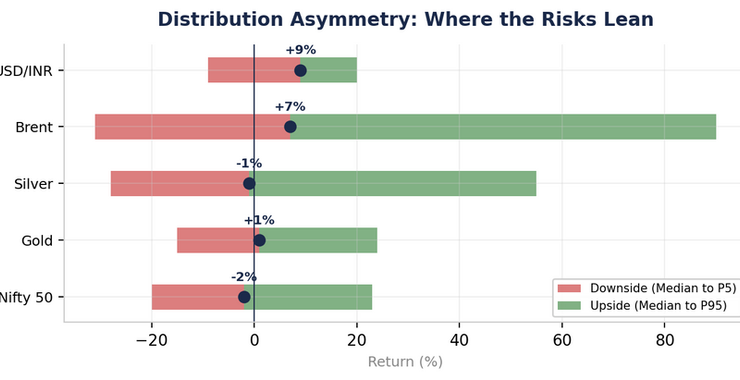
Exhibit 2: Distribution asymmetry. Brent crude's extreme right tail (+90% vs. -31%) is the defining feature. Equities lean left. Gold and silver have wide upside tails.
The Bottom Line
The structural growth story is intact. The cyclical environment is hostile. Energy supply risk is the dominant variable, the rupee faces pressure from multiple directions, equities carry a mild bearish tilt with meaningful upside only in de-escalation scenarios, and gold functions as the most stable store of value across the range of outcomes.
About This Report
India Macro Outlook 2026 Published: March 2026
Produced by: Investopic Research
Engine: IndQuant DDPM Quantitative Model
Coverage: Nifty 50, Gold, Silver, Brent Crude, USD/INR
Scenarios: 47 | Simulated paths: 25,000 | Horizon: 9 months
Disclosure
This Study is produced for informational and analytical purposes only. It does not constitute investment advice, a recommendation, or a solicitation to buy, sell, or hold any financial instrument. The analysis relies on quantitative models with inherent limitations including limited historical parallels, static probability assignment, and single-window training. Past performance does not guarantee future results. All scenario probabilities, distributional outputs, and sensitivity estimates are model-implied and subject to uncertainty. No content in this report should be interpreted as a buy, sell, hedge, or allocation recommendation. All observations describe model-implied distributional characteristics; they do not prescribe portfolio action. Data as of March 2026.